Flight Test Studio (FTS)
Having traced the
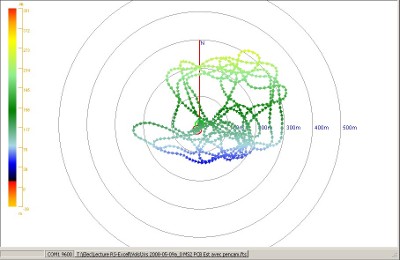
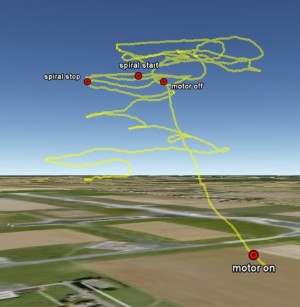
trajectory of your flight
in Google Earth (TM) is funny but has no great use to investigate
properly. Similarly, having only the plots of a logger does not help
either.
Merging the GPS data with precisely dated manouvers of your flight, corresonding test conditions and logged data is much more efficient. Being able to isolate a portion of the flight and correlate all these data from different sources is simply what you need to analyse your flight:
See this portion of a flight during a thermal and the corresponding Air speed and Altitude:
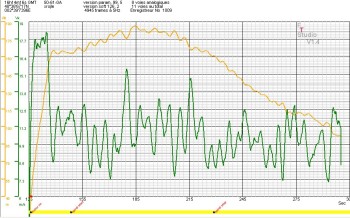
Please note the correponding point on the time line on the X axis and on the GE trajectory.
You can then connect the jumps in altitude with the wind direction and, along with a fourier analysis, the dynamic stability of the model.
It was not very well centered in the thermal, was it?
The FTS concept is to merge conveniently all the sources of flight data.
Free with the Xérus acquisition module
- Imput your Xerus data with calibration coefficients
- capture the flight conditions and the model characteristic
- Set up the zero of your measurements
- Calculate devired data from raw data
- calculate aerodynamic data
- Analyse with teime display up to 16 curve per plots
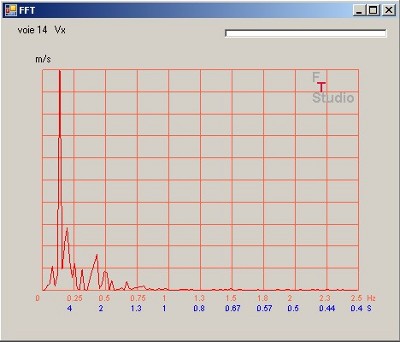
- Fourier analysis for stability and resonance investigation
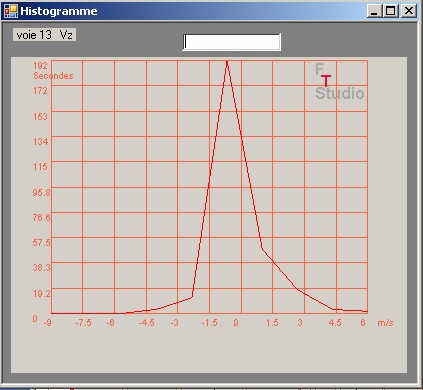
- Histogram your flight data to produce statiscal plots
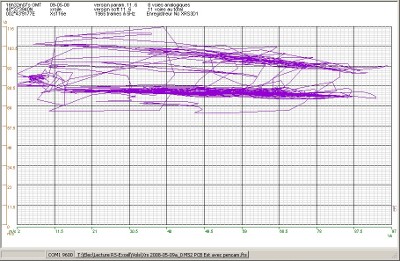
- Display XY plots to trace measured polar or any combination
- Instruct the time line with the flight events
Merging the GPS data with precisely dated manouvers of your flight, corresonding test conditions and logged data is much more efficient. Being able to isolate a portion of the flight and correlate all these data from different sources is simply what you need to analyse your flight:
See this portion of a flight during a thermal and the corresponding Air speed and Altitude:
Please note the correponding point on the time line on the X axis and on the GE trajectory.
You can then connect the jumps in altitude with the wind direction and, along with a fourier analysis, the dynamic stability of the model.
It was not very well centered in the thermal, was it?
The FTS concept is to merge conveniently all the sources of flight data.
Free with the Xérus acquisition module
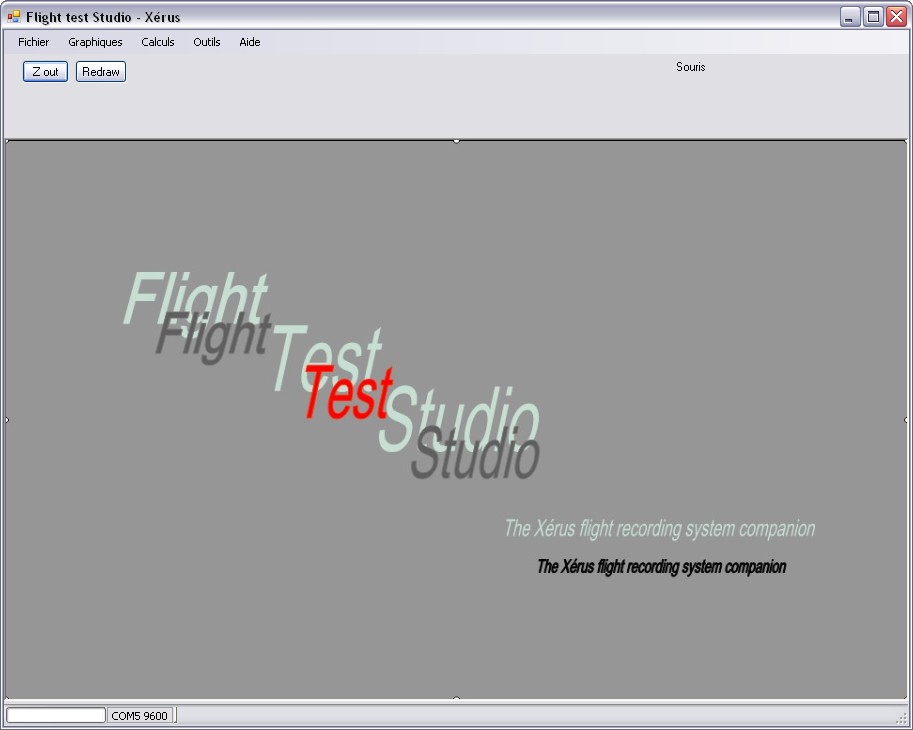
Flight test Studio allows you to analyse deeply your flight in differed time with powerful professional tools:
Use the included capability or export your Xérus data to Excel to make your own calculations.
FTS guides you to a data reduction methodology:- Imput your Xerus data with calibration coefficients
- capture the flight conditions and the model characteristic
- Set up the zero of your measurements
- Calculate devired data from raw data
- calculate aerodynamic data
- Analyse with teime display up to 16 curve per plots
- Fourier analysis for stability and resonance investigation
- Histogram your flight data to produce statiscal plots
- Display XY plots to trace measured polar or any combination
- Instruct the time line with the flight events
- Store properly your flights and retreive them in a database like display
- Export your measured data to Excel
Specifications
FTS v3.1:
Run on any Windows PC with framework 3.0 and higher
Up to 20 curves on the same display.
Variable lenght Fourier Transform
Run on any Windows PC with framework 3.0 and higher
Up to 20 curves on the same display.
Variable lenght Fourier Transform
Related Readings:
Mathieu Scherrer - CL calculation and flight analysis article
Marc Pujol article on F3B flight and strategySample plots gallery
Time history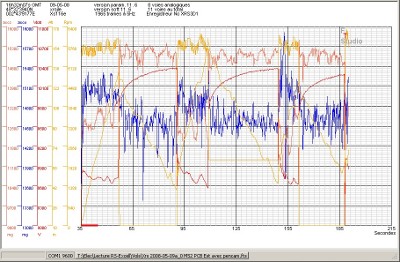
Measured polar
CL Lift plot (Matthieu Scherrer method)
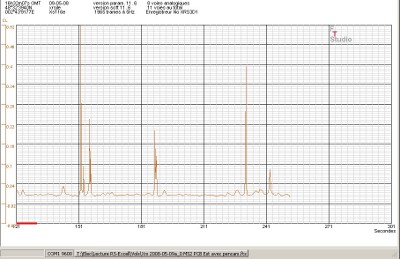
Fourier analysis Data histogramming
GPS trajectography plot with or without Google earth map